• Learn
  • Pricing
  • Create a ShowMe
  • Sign Up
  • Login
  • Home
  • Create a ShowMe
  • Learn
  • Pricing
  • Blog
  • Community Guidelines
  • FAQ
  • Contact Us
  • Log In
  • Sign Up
  • Edit Profile
  • Edit ShowMes
  • Students
  • Students' ShowMes
  • Settings
  • My Subscriptions
  • ShowMe Ambassadors
  • Logout
ShowMes
most-viewed-thumbnail
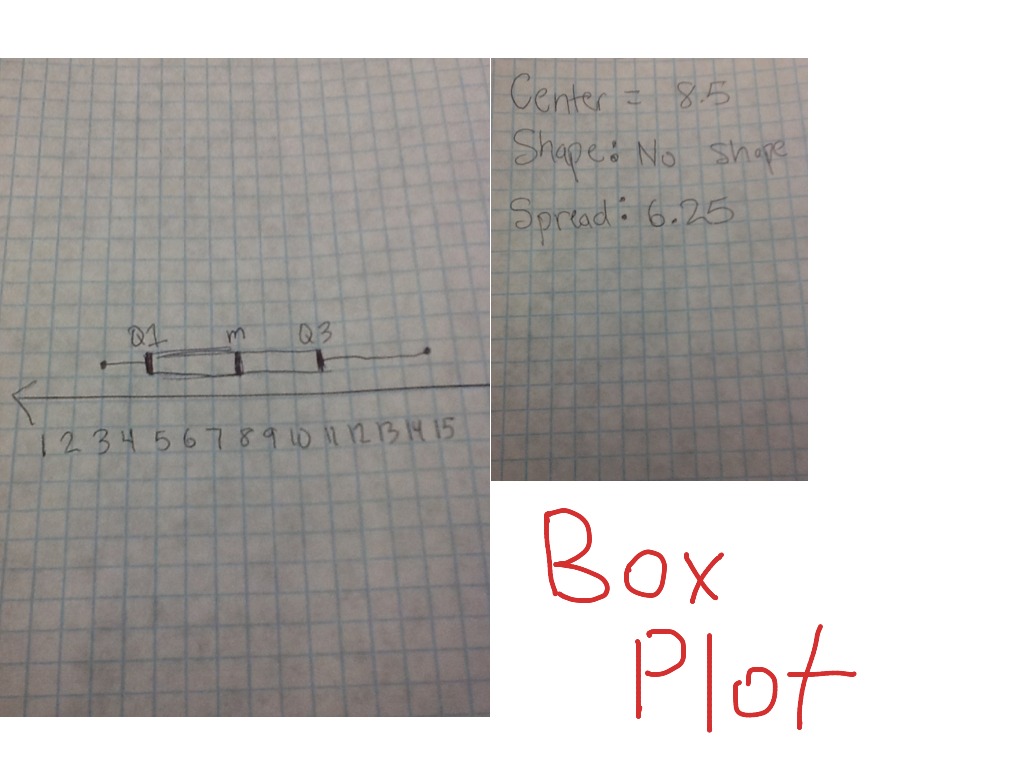
Different Statistic Graphing - Histogram, Dot Plot, Box Plot
by crator-avatar August Thompson 0
  • 0:32
  • 0
  • 12 years ago
Topics
No results found
People
avatar
dot dot dot ...
avatar
Dot dot
avatar
Graphing Inequalities
avatar
Armelle Plot
Courses
No results found.

You must be logged into ShowMe

- or -
About Contact Us FAQ Privacy
Privacy Terms Of Use Copyright Terms Of Use Community Guidelines Blog NytStnd Docks 10% OFF Promo SHOWME
Community Guidelines Blog NytStnd Docks 10% OFF Promo SHOWME
© 2025 ShowMe. Made in NYC

Please wait