• Learn
  • Pricing
  • Create a ShowMe
  • Sign Up
  • Login
  • Home
  • Create a ShowMe
  • Learn
  • Pricing
  • Blog
  • Community Guidelines
  • FAQ
  • Contact Us
  • Log In
  • Sign Up
  • Edit Profile
  • Edit ShowMes
  • Students
  • Students' ShowMes
  • Settings
  • My Subscriptions
  • ShowMe Ambassadors
  • Logout
Dot plots...skew.....best measure of central tendency
by
Maureen Whaley 11 years ago
user-avatar

  • Math
  • Statistics
  • Dot Plot
3
11 years ago
3
  • Math
  • Statistics
  • Dot Plot
Related ShowMes
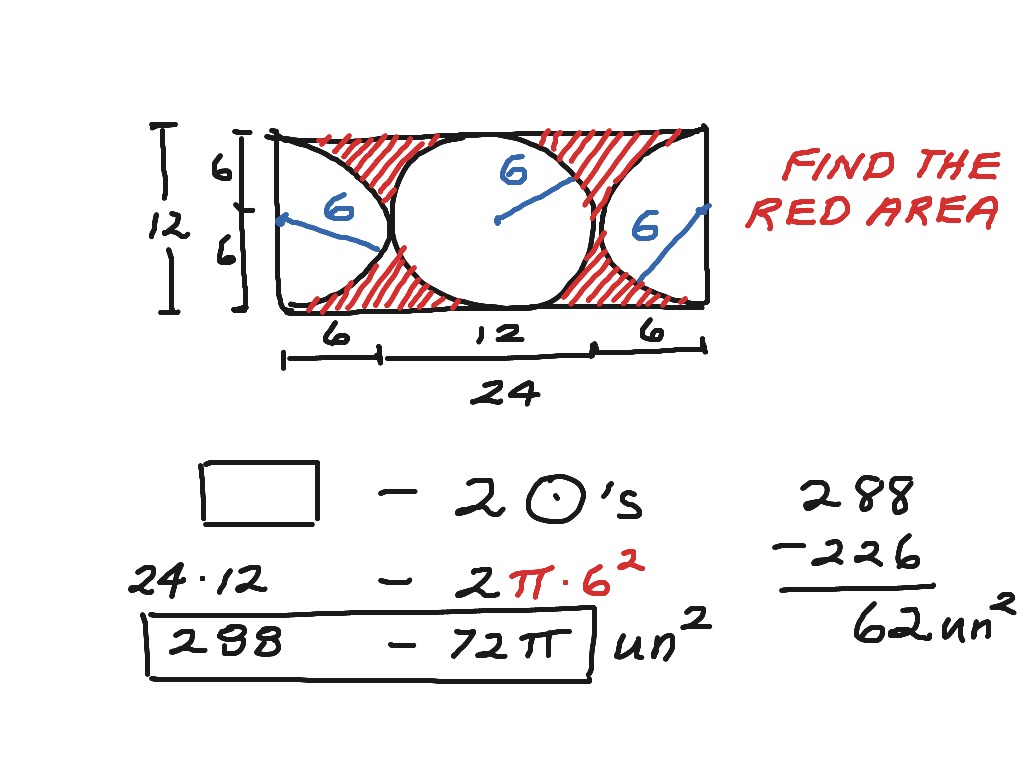
11.5 Circumferences and...
by avatar Susan Regalia 706
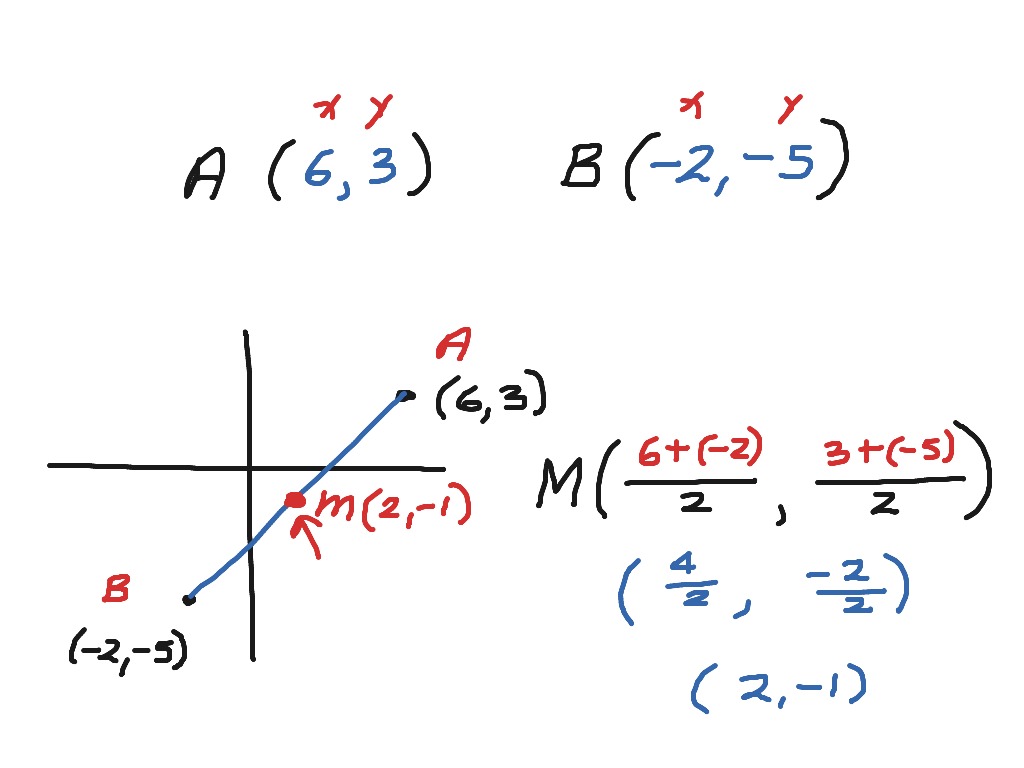
13.5 Midpoint Formula
by avatar Susan Regalia 294
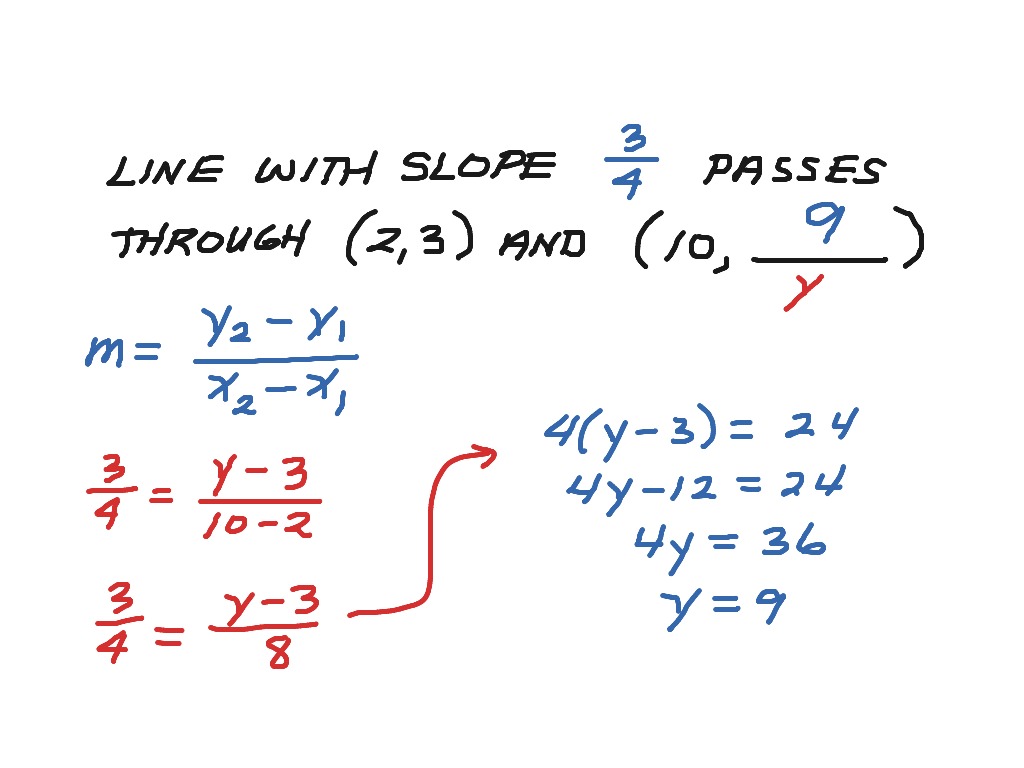
13.2 Slope of a Line
by avatar Susan Regalia 256
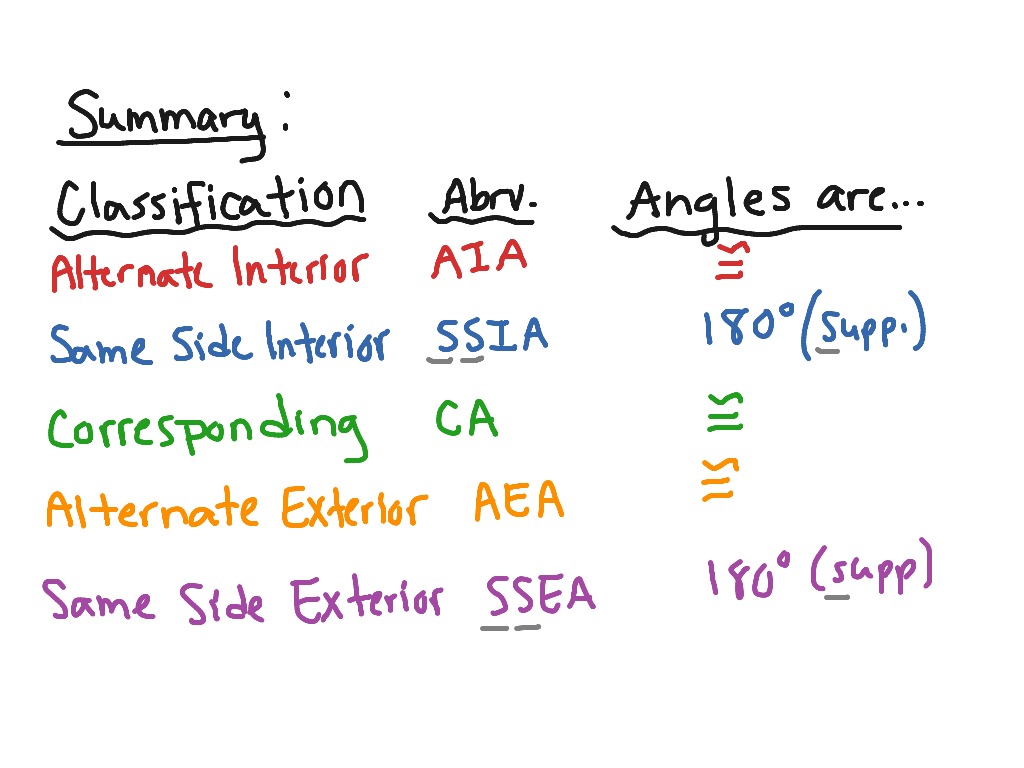
Properties of Parallel Lines
by avatar Erin Larson 106
3 people liked this ShowMe
  • follower
  • follower
  • follower
Flag ShowMe
Viewed after searching for:
  • choosing the best measure of central tendency
  • Lewis dot Structure of mgcl2
  • 11.1. Independent practice dot plot go math
  • comparing data displayed in dot plots
  • Dot plots range

You must be logged into ShowMe

- or -

Are you sure you want to remove this ShowMe? You should do so only if this ShowMe contains inappropriate content.

Are you sure you want to remove this ShowMe? You should do so only if this ShowMe contains inappropriate content.

Available with ShowMe Premium subscription
Share ShowMe by Email
Separate multiple emails with commas

About Contact Us FAQ Privacy
Privacy Terms Of Use Copyright Terms Of Use Community Guidelines Blog NytStnd Docks 10% OFF Promo SHOWME
Community Guidelines Blog NytStnd Docks 10% OFF Promo SHOWME
© 2025 ShowMe. Made in NYC

Please wait